Optimize your campaign at any moment to maximize performance
The statistics dashboard gives you real-time insight into your users, how they behave inside your experience, bot sign-ups and clicks on outbound CTAs.
Analyze exactly the data you care about in a few clicks, with filters by game type, date and location.
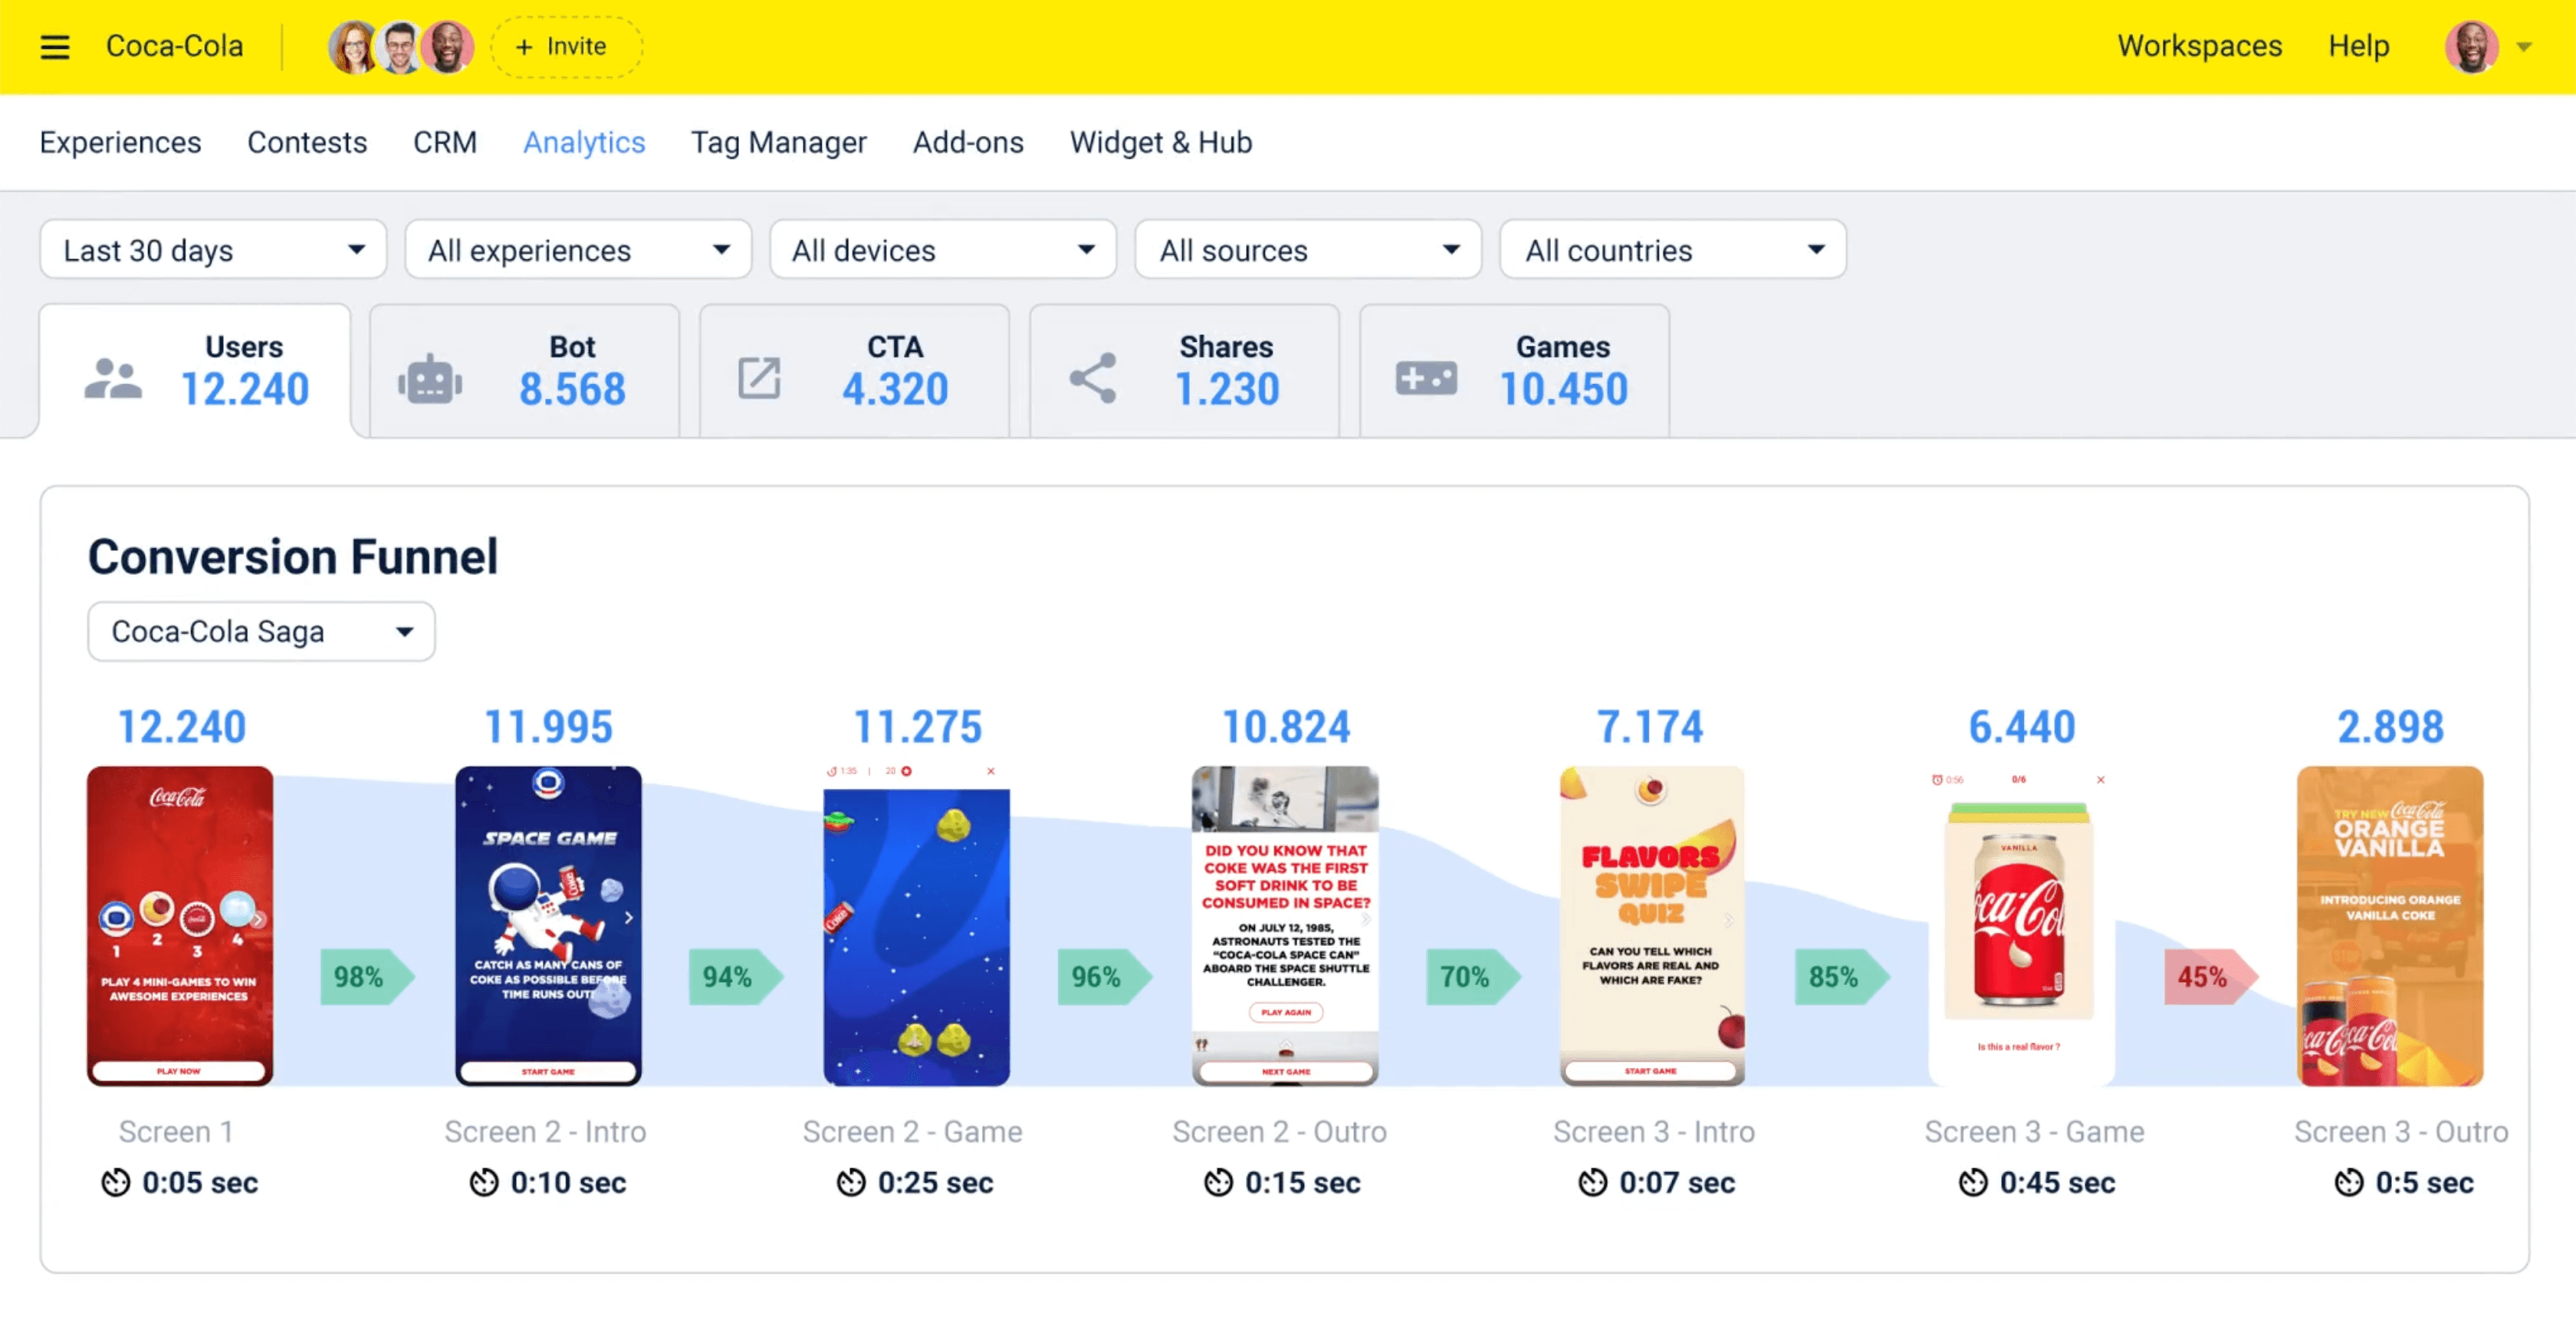
See how users behave inside your experience
With a wide range of charts and data types, you can follow each user's path through your experience. You get a screen-by-screen view and can measure what share of users make it all the way through the funnel. In a few clicks you also see the devices used, along with precise information on operating systems and browsers.
Reconstruct the user journey
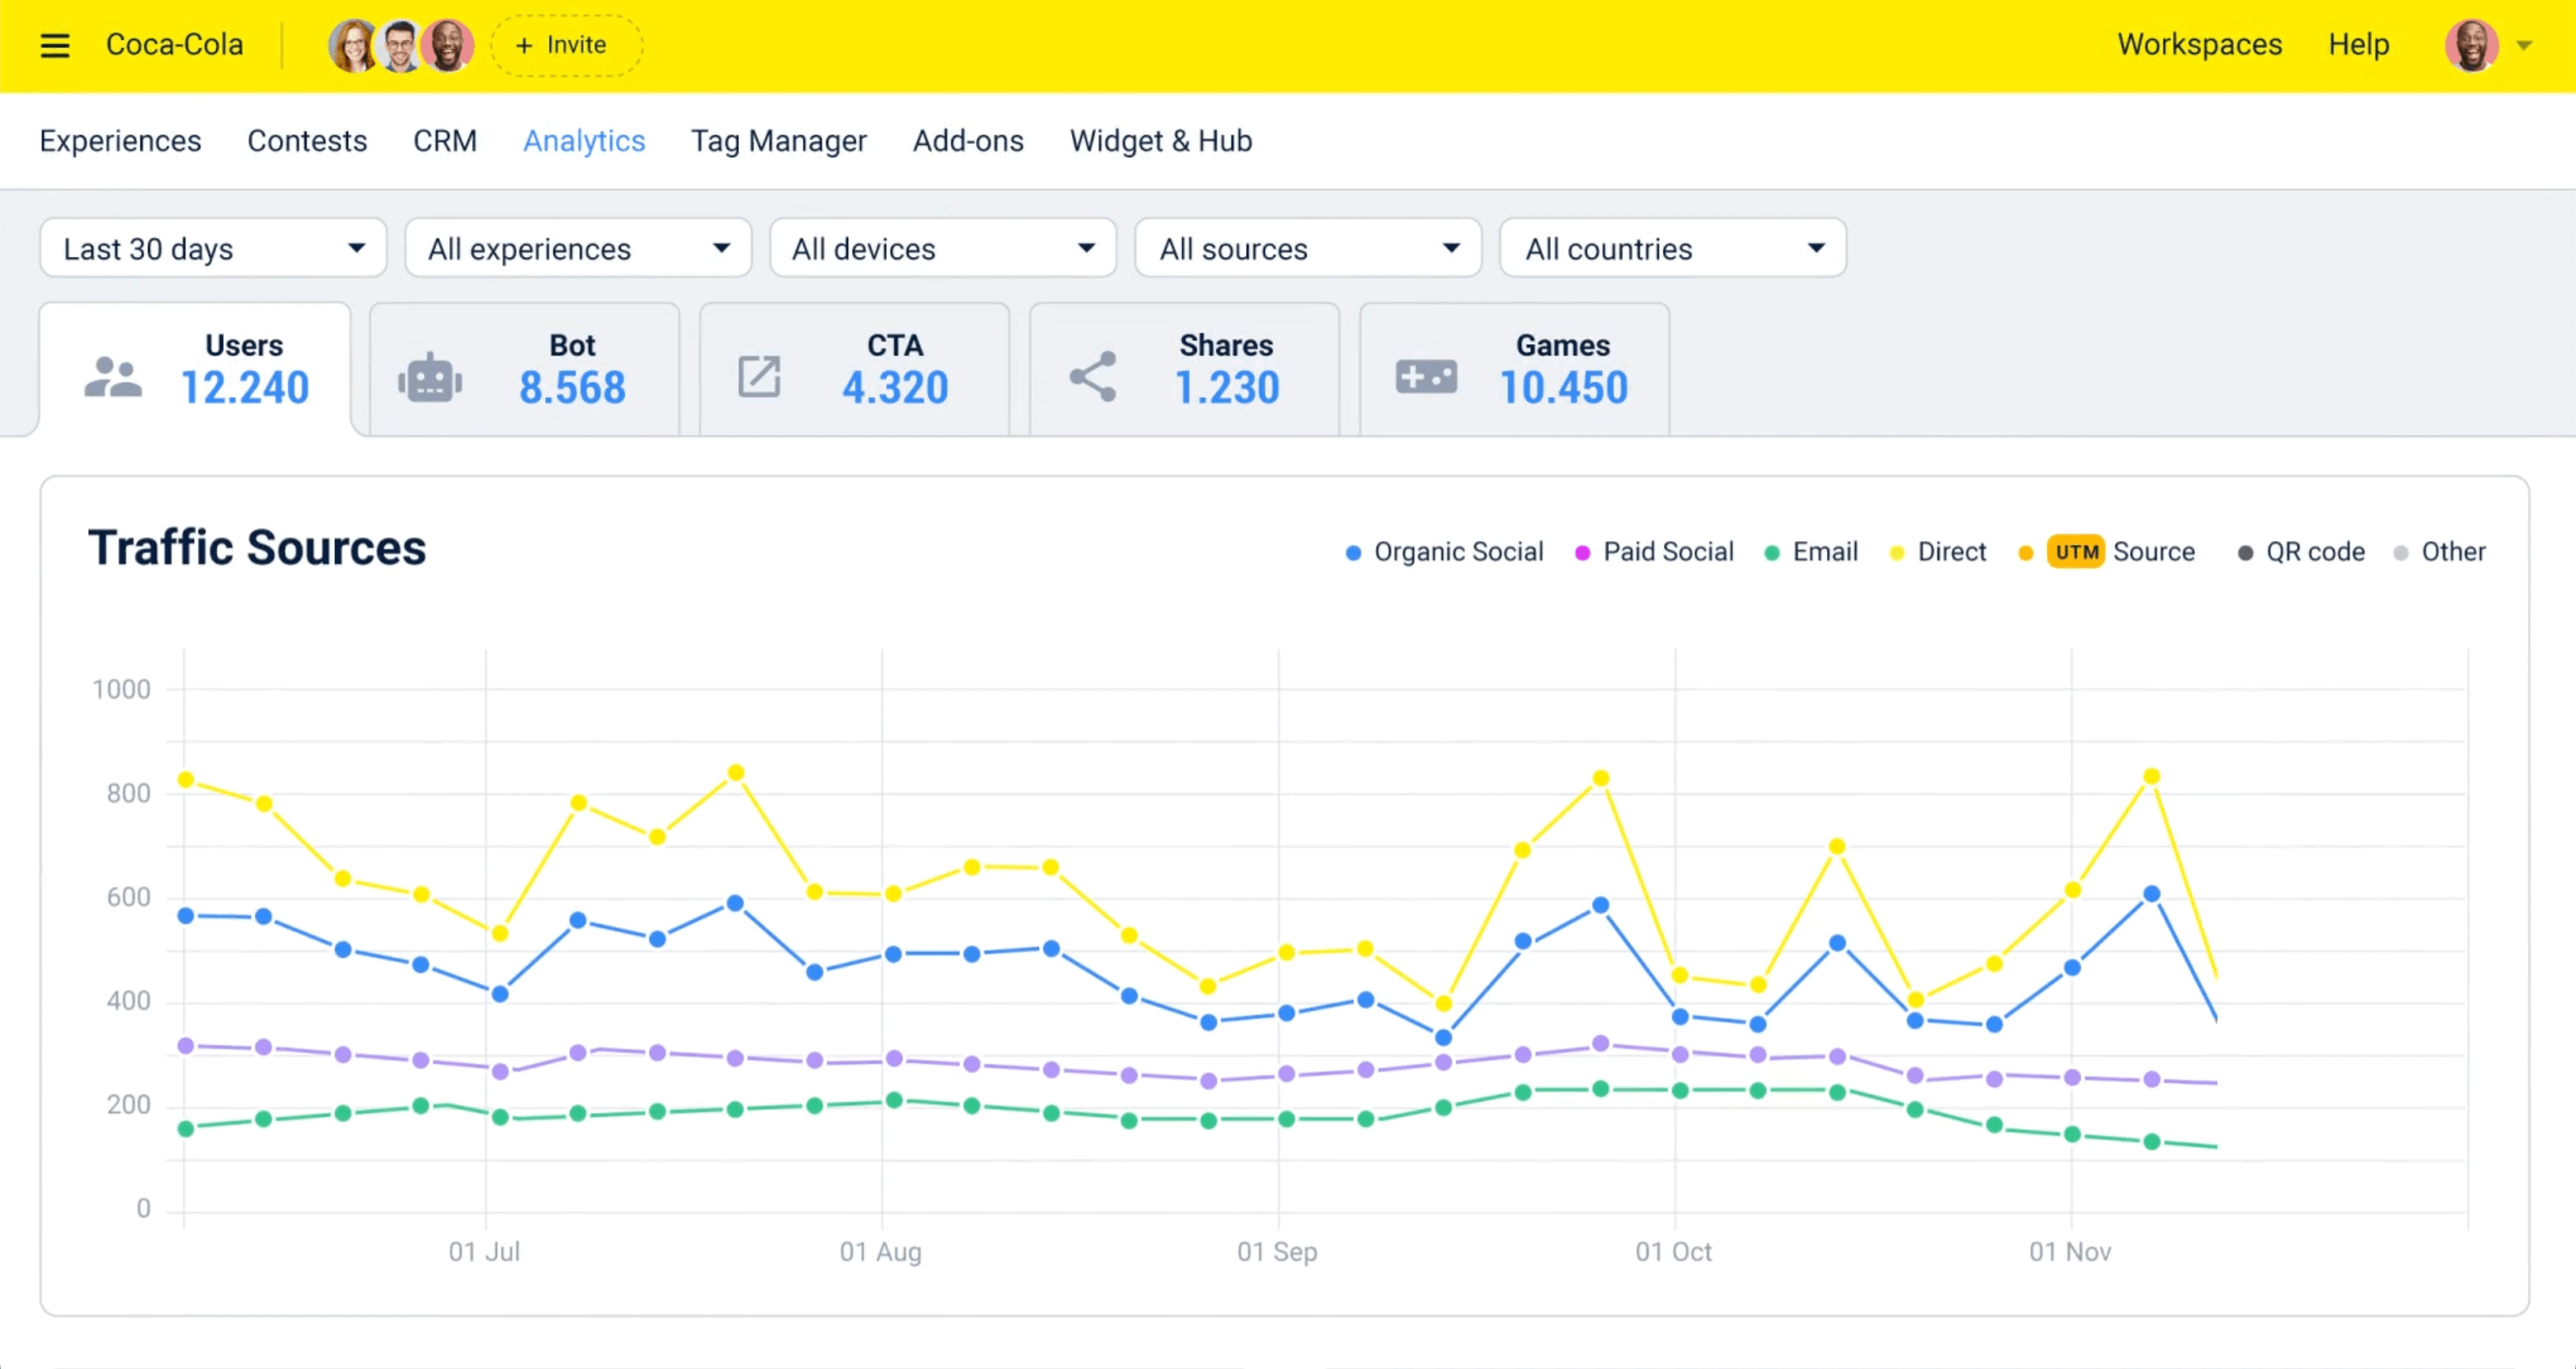
Identify clearly where your game's traffic comes from. A chart of sources over time reveals your traffic peaks and lets you adjust your communications in real time.
Add UTMs to your game's URL and get a dedicated chart for each UTM type, right inside the dashboard.
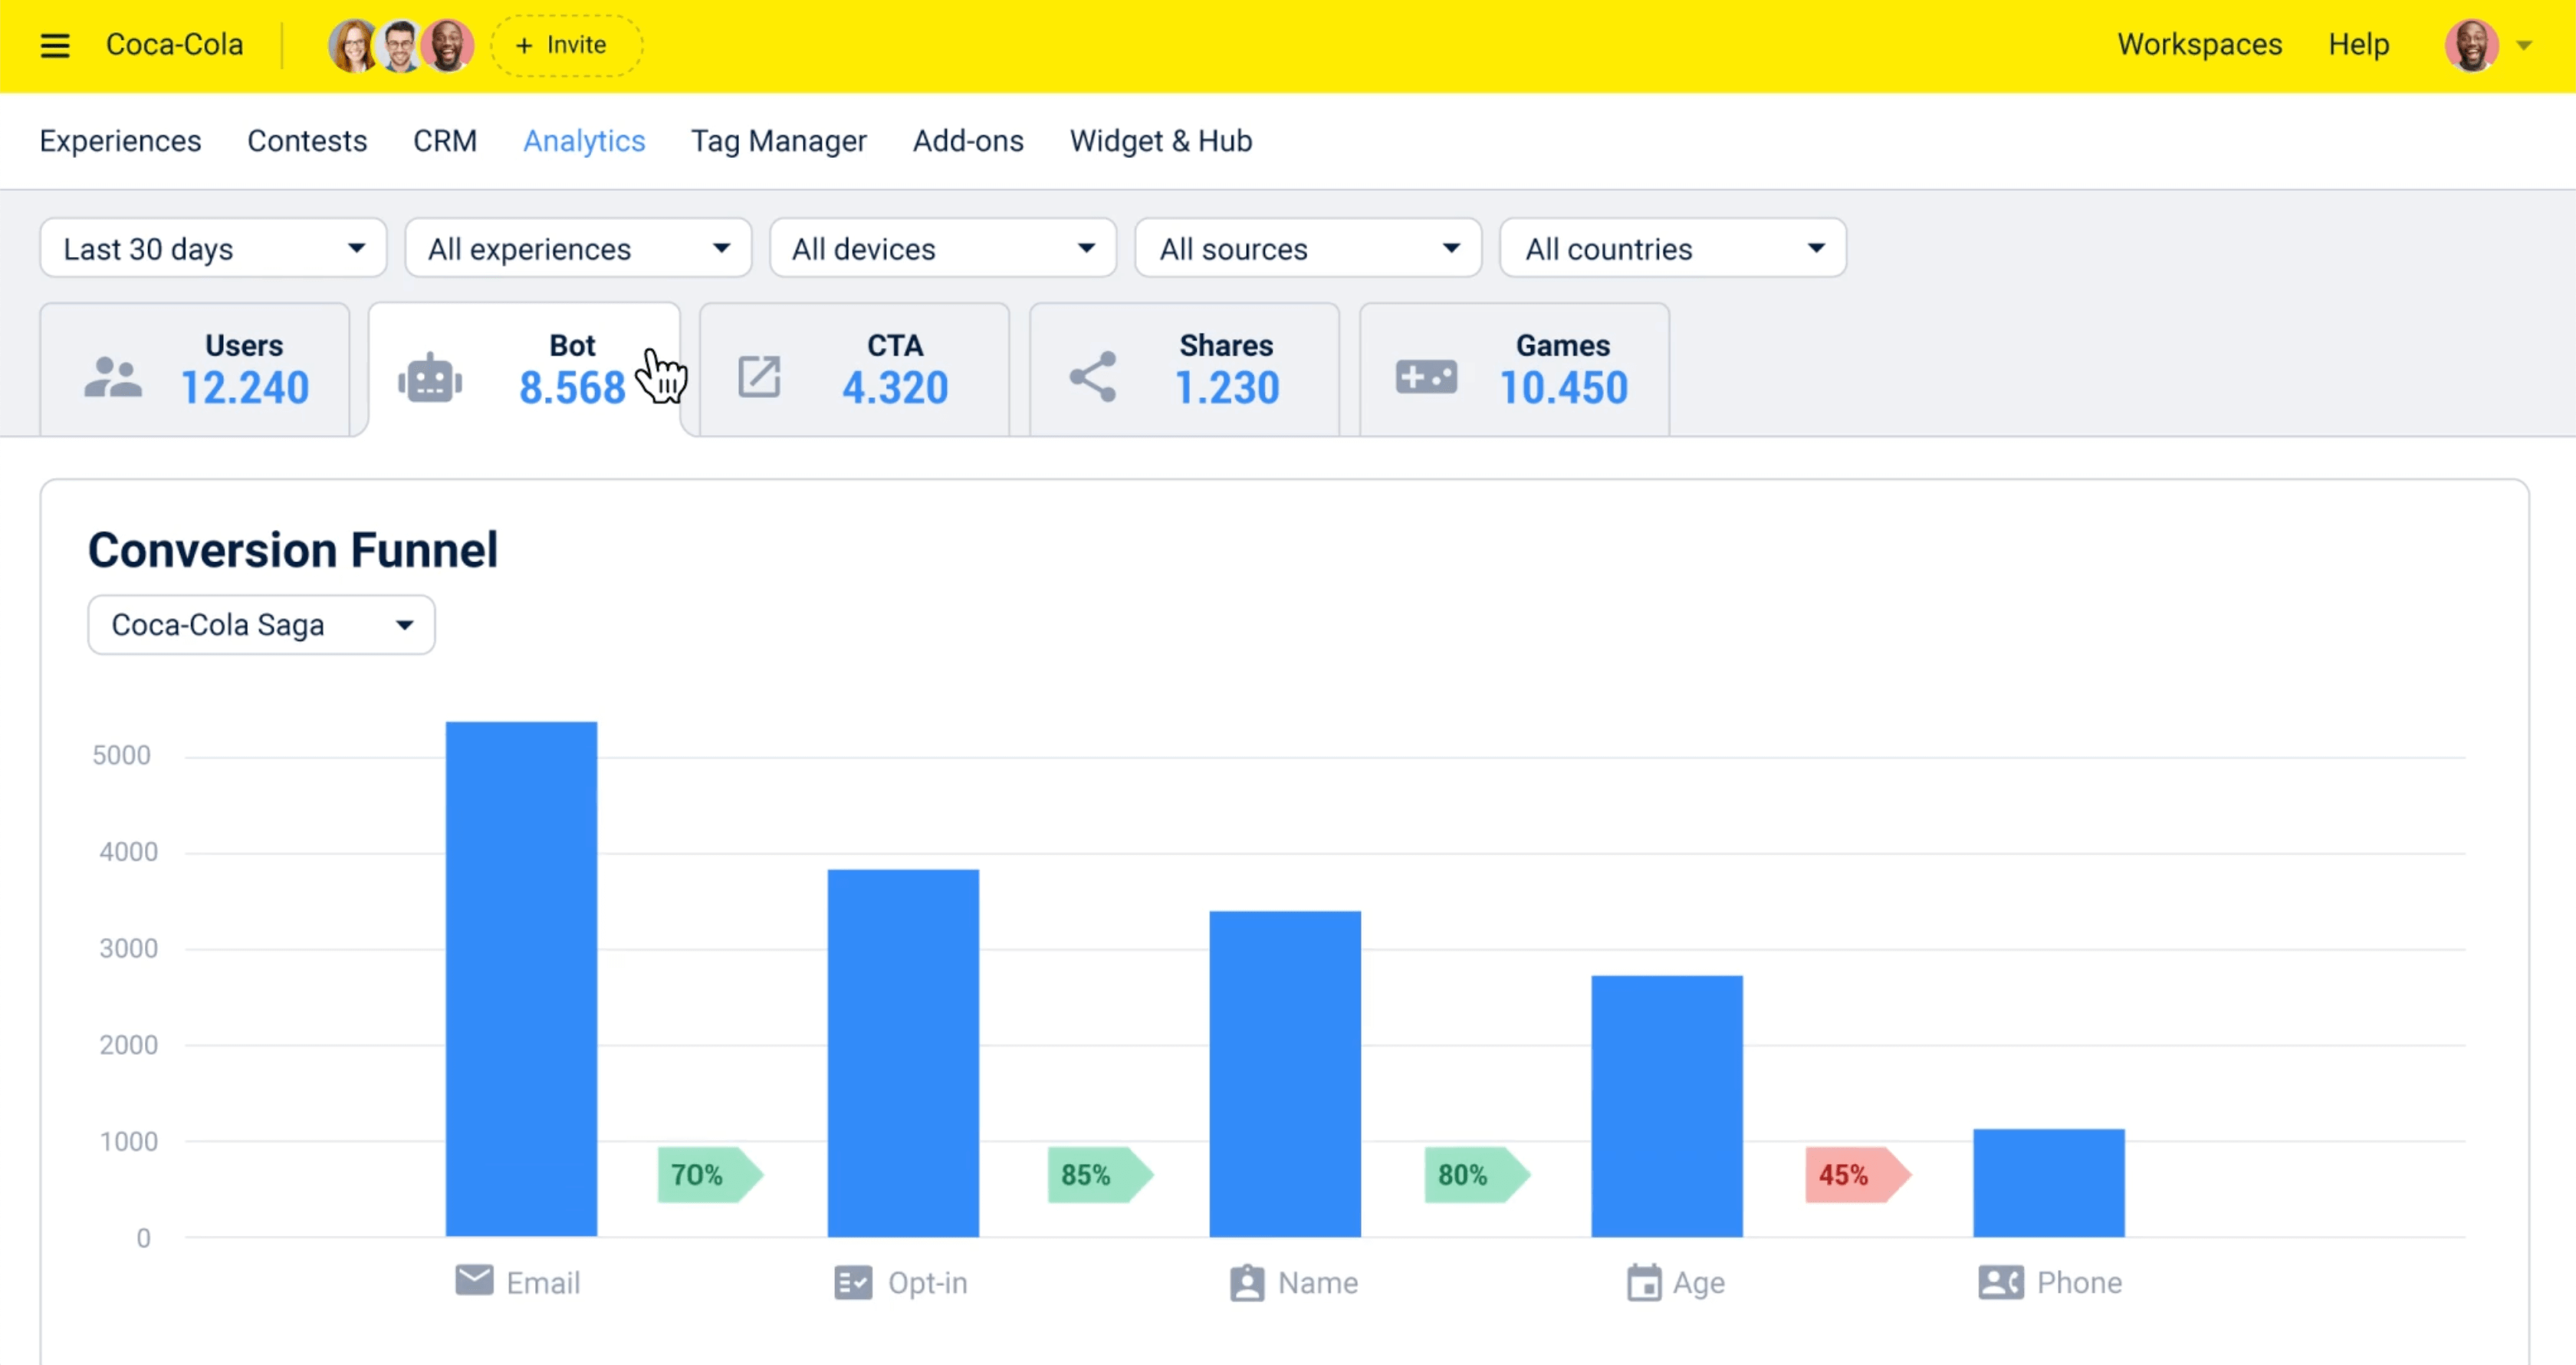
Analyze your bot's performance
At a glance, you understand how the bot qualifies and how many answers are collected for each question. Seeing the collected data broken down by source lets you make the right decisions at the right time. Turn your bot into a high-performance tool for gathering exactly the information you need.
"The results of the games were absolutely incredible, with over 850k games played in 3 weeks, more than 100k players and over 30k Discord IDs collected! In terms of engagement, the community really showed up."

 Sport
Sport Live in-Stadia
 Sponsors
 Events
 Brands
 Agencies
 Music
Music Contests
 Web Stories
 Prizes
 Qualifying bot
 Analytics
 Audience
 Fanzone
 Blocks
 Sponsors
 Promos flash
 Membership
 Catalog
 Templates
 Penalty 3D
 Basketball 3D
 Rugby 3D
 Baller 3D
 Roue 3D
 Pronostics
 Candy Crush
 Bubble Shooter
 Piano Game
 Full services
 Contact
 Test marketing
 Integrations
 Contact
 Blog
Blog Mobile-first Ebook
 Rules generator